Extract weather and climate data from online repositories
September 13, 2019
In a world experiencing climate change, good weather and climate data matters. It may be available but often hard to find, understand and apply to decision-making mainly because:
- There are no weather stations everywhere
- Weather stations are not in good condition (gaps)
- The data is not stored correctly
- The data does not pass the basic quality controls
- Access to data is restricted
However, weather and climate data products derived from satellites and model-based reanalysis have been used in locations where station based observations are inadequate or incomplete.
We will explore methods of extracting weather and climate data from NASA Power
If you chose to extract data from NASA Power, have your coordinates ready then visit the NASA Power website and download manually.
 However, this can be painful if you have alot of sites. The solution is to develop custom scripts to automate downloading. For this you’ll need:
- R
- RStudio (optional)
- Packages to make easier management of the data
- Your list of stations with coordinates stored as a
.csvfile
We will extract two parameters i.e. precipitation and temperature, on a daily time step. For more information about other parameters nand temporal resolutions available see here. The API allows you to:
- Make HTTPS GET calls to the POWER data archives directly.
- Integrate the service into your own applications.
For a sample SinglePoint, here is the call to the API.
The nasapower R package has been developed for this! It makes it easy to:
- Automate downloading from NASA-POWER website.
- Generate input data for use in crop models like APSIM or DSSAT.
To pull daily data from the API for a single coordinate, you will first need to load nasapower R package through , then use the get_power function as shown below.
daily_ag <- nasapower::get_power(community = "ag",
                      lonlat = c(43.13333, 11.55),
                      pars = c("T2M", "PRECTOTCORR"),
                      dates = "2010-01-01",
                      temporal_api = "daily"
                      )
What about many sites? i.e sites > 1. For this, you will need a bunch of libraries besides nasapower R package.
library(nasapower)
library(data.table)
library(tidyverse)
Next, create your own station data.
ID <- c("63125", "63021", "63023")
Lat <- c(11.55, 15.283333, 15.616667)
Long <- c(43.133333, 38.916667, 39.45)

sites <- data.frame(ID, Lat, Long)
Create a list to store your data.
daily_ag <- list()
Using a for loop, download for each station.
for(i in 1:nrow(sites)){

  site_row<- sites[i,]

  daily_ag[[i]] <- nasapower::get_power(community = "ag",
                             lonlat = c(site_row$Long, site_row$Lat),
                             pars = c("T2M", "PRECTOTCORR"),
                             dates = c("2008-01-01", "2018-12-31"),
                             temporal_api = "daily")

  site_id = site_row$ID

  daily_ag[[i]]$site_id <- site_id

}
Create one data table from the list saved above.
data <- rbindlist(daily_ag)
We can do some visualization. But first let’s group the data by site_id then YEAR using pipes: read as, and then.
data_prec <- data %>%
  group_by(site_id, YEAR) %>%
  summarize(annual_prec = sum(PRECTOTCORR, na.rm = TRUE))
The dataset has three variables that need fixing.
# color and split variables
data_prec$site_id <- as.factor(data_prec$site_id)
data_prec$YEAR <- as.factor(data_prec$YEAR)
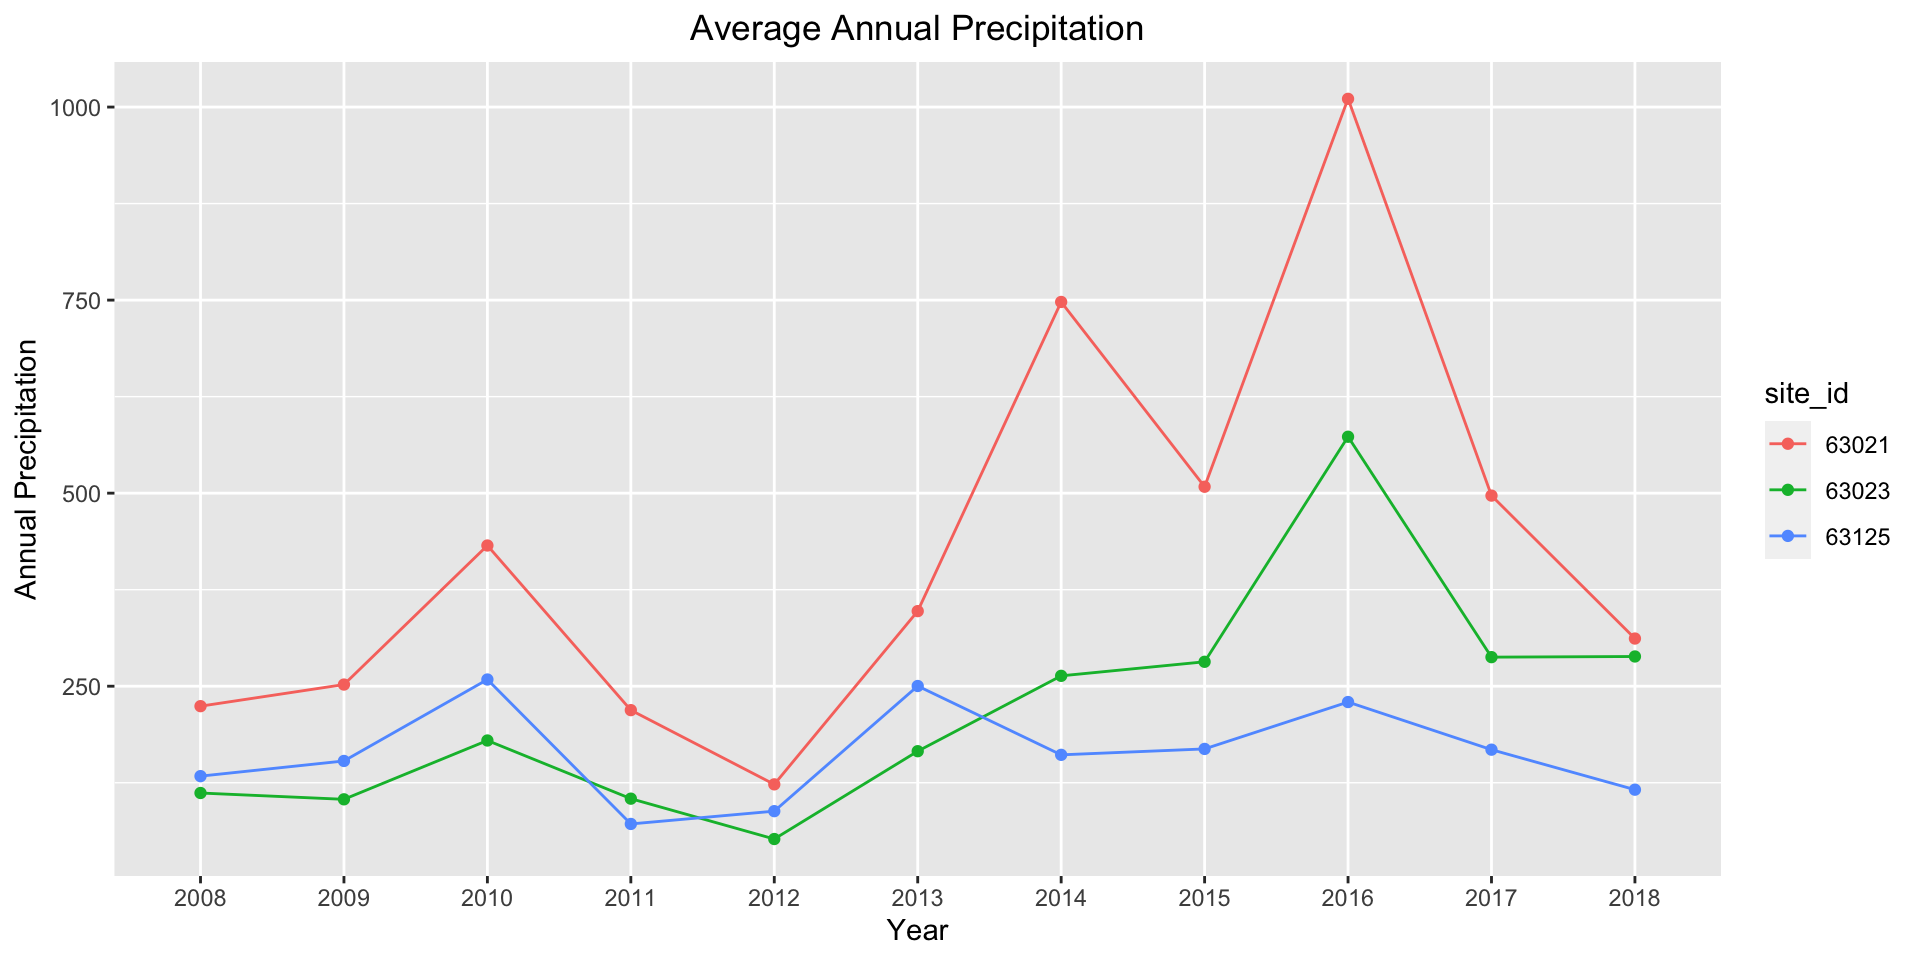
Plot annual precipitation.
ggplot(data_prec, aes(x = YEAR,
                           y = annual_prec,
                           color = site_id,
                           group = site_id)) +
  geom_line()+
  geom_point()+
  ggtitle("Average Annual Precipitation") +
  xlab("Year") + ylab("Annual Precipitation") +
  theme(plot.title = element_text(hjust = 0.5))
- Posted on:
- September 13, 2019
- Length:
- 3 minute read, 507 words